


Excel dashboards enable users to visualize their most important Excel data, so KPIs can be viewed by everyone, at a glance.
Excel spreadsheets themselves are a popular way of sharing key metrics with team members and stakeholders.
Excel dashboards enable users to visualize their most important Excel data, so KPIs can be viewed by everyone, at a glance.
Excel spreadsheets themselves are a popular way of sharing key metrics with team members and stakeholders.

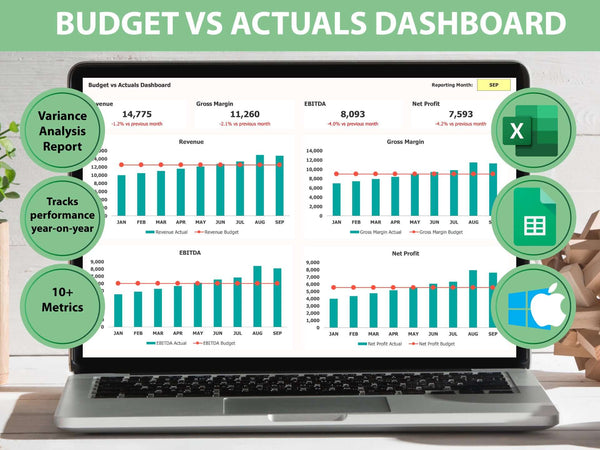
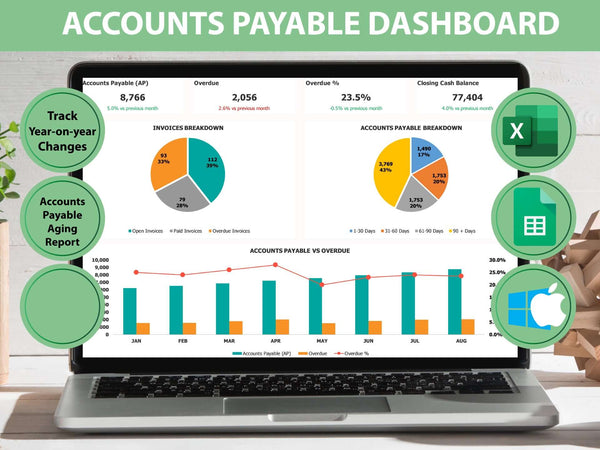
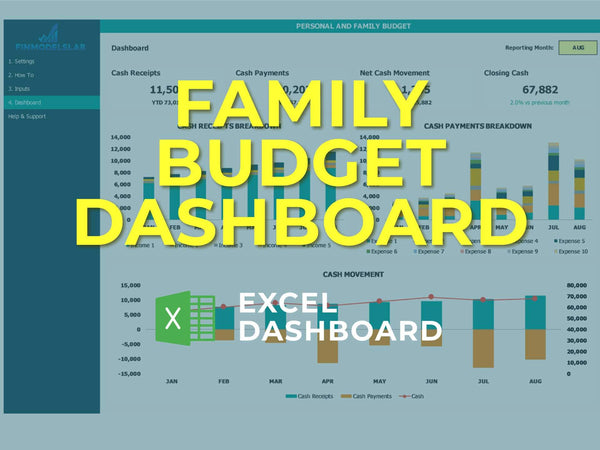
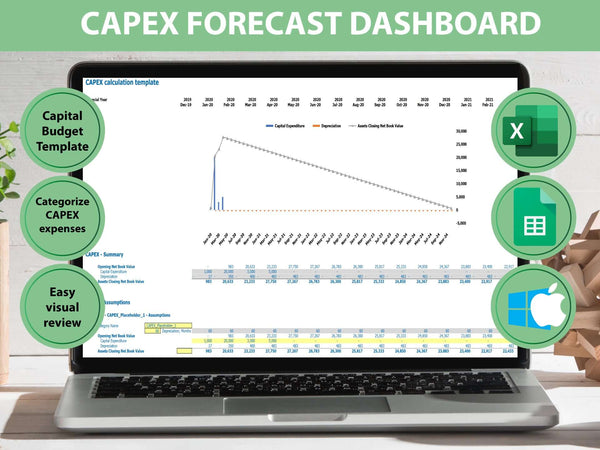
This finance dashboard visualizes company finances, so everyone in the business can stay up to date on the financial health of the organization. It tracks revenue, expenditure and the overall cash position of the company. As we can see, it has been a tough year, with revenue not matching initial projections.
The benefit of visualizing financial KPIs like this is that everyone has a clear understanding of the company’s financial projections. This means the Finance Director or CEO can spend less time explaining the basics of financial performance, and more time explaining goals, priorities and overall company direction.

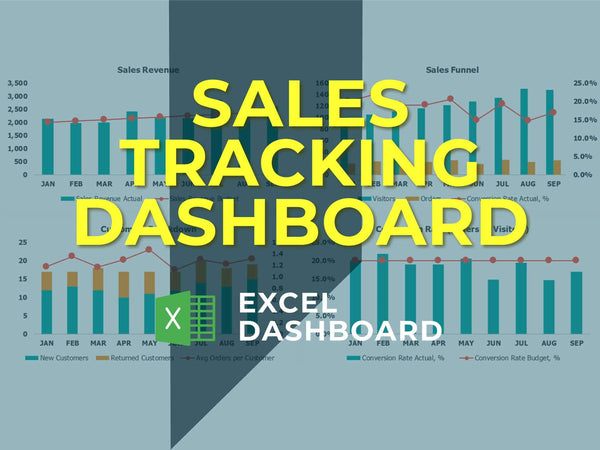
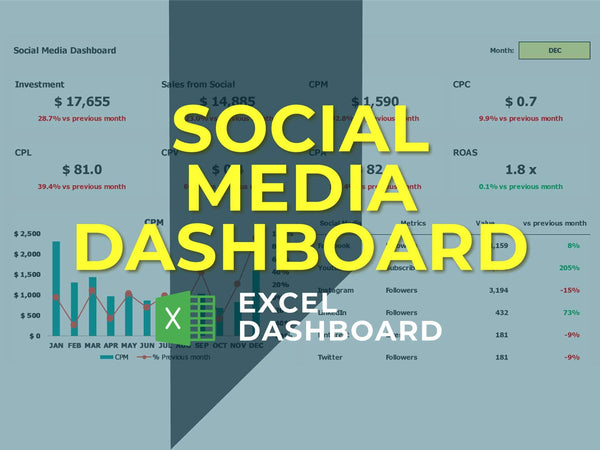
This sales tracking dashboard focuses on sales KPIs across the financial year. The Sales team is responsible for generating new orders, as well as seeing that invoices are paid when the work is completed. As a consequence, the team needs to stay aware of metrics related to both order and invoices.
The dashboard also shows metrics related to sales activity higher up the funnel, in the form of new opportunities and opportunities at 90% (i.e. those which are expected to convert very soon.)

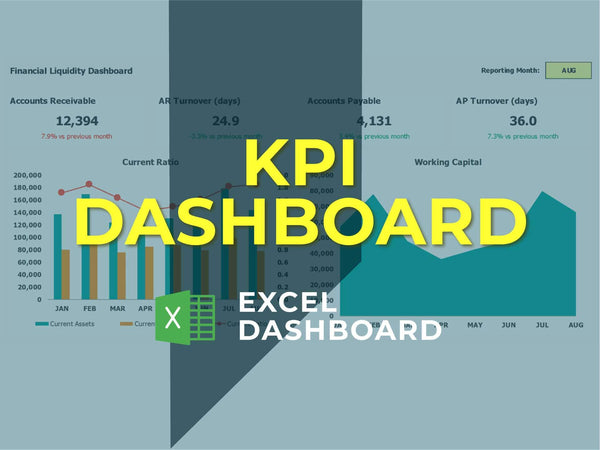
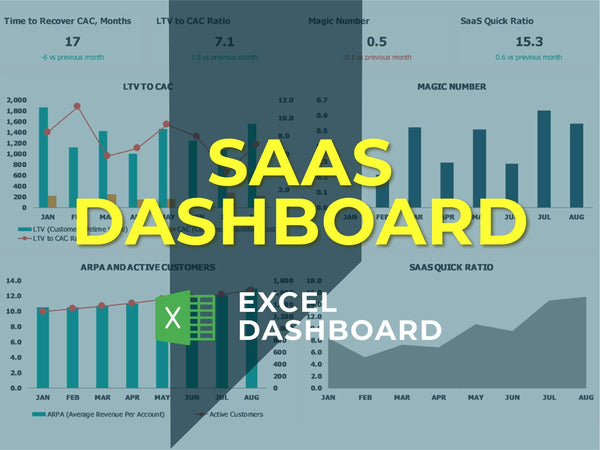
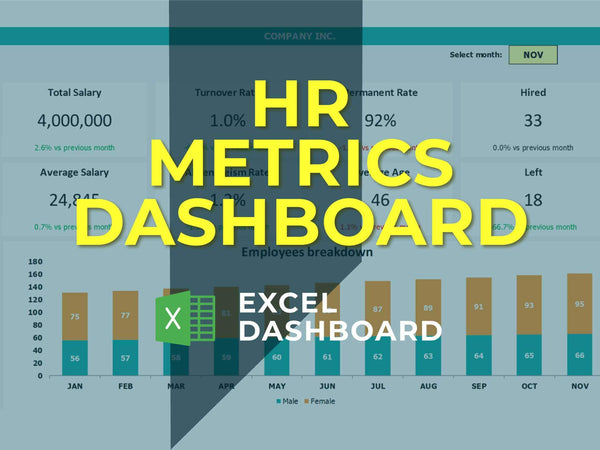
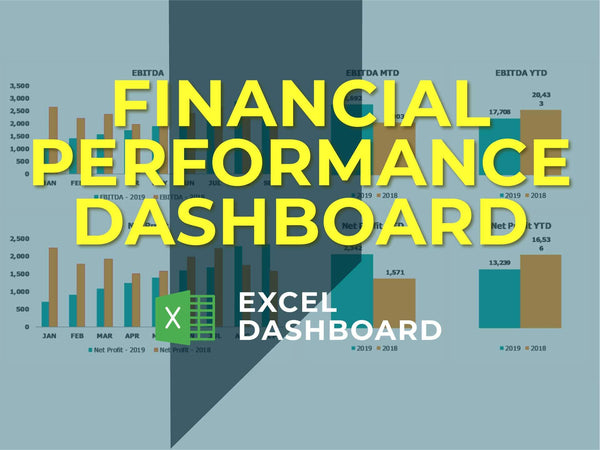
This KPI dashboard visualizes high-level company KPIs from a small SaaS company. Any saved changes to the Excel file are immediatelly shown at the dashboard automatically, and this ensures that only up-to-date information is displayed to the team.
As a result, everyone in the company has a real-time view of company performance. They have a clear view of the company’s progress towards its goals. They also can keep track of important health metrics like Revenue. And if any of these metrics suddenly change, the team will be aware, meaning they can investigate and take action.
There are lots of benefits in using dashboards:
--> Quick access: Because a dashboard collects data from different sheets and tables, you can immediately access and see the information you need in one glance.
-- > Saves time: No need to go through different sheets and tables sifting information. With a dashboard, just one look and you will be able to find what you’re looking for.
--> Easy to learn and use: You don’t have to be an Excel Visual Basic expert to use a dashboard. That means organizations can empower their own employees to use one to analyze and present their own data.
--> Spot (and test) errors quickly: Because it’s Excel, it’s easy to test for errors in your data. Just run a search for what’s missing and do changes. Immediately, you’ll be able to see the results.
--> Pleasing to the eyes: Just because Excel, in general, is powerful, there’s no need for the dashboards to look boring. In fact, most dashboards have a magazine-like quality to it.
Suffice to say, it would do you good to acquaint yourself with Excel dashboards especially if you’re handling and analyzing data regularly.
--> A drop-down list is a space-saving solution of great value when you create one-page dashboards. You can use data validation to control the type of data or the values that users type into a cell. To build the list of options is to type them on a worksheet. You can do this method on the sheet with the drop-down menus or a different worksheet.
--> Conditional formatting is the right choice if you want to highlight cells based on any condition or rule. But, of course, you can use other methods besides colors. For example, you can achieve splendid results using icons, bars, shapes, color scales, indicators, and ratings.
--> Named ranges: You can call selected cells with any given name. First, highlight a range that contains data. Then, in the name box, write the chosen name: ‘sales.’ From this point, you can save your time working with cells or ranges.
--> Data Validation: Restrict what users can write in a single cell. Just imagine that ten users in 10 Excel workbooks write phone numbers. If you do not restrict the format of the phone numbers with the help of data validation when summing up the spreadsheets, there might be mistakes.
--> Excel Pivot Tables are the most potent weapon in Excel when working with large data sets. It is easy to use with only a few clicks; we can summarize data and drill down the data into any chosen structure.
A manager would probably only be interested in the insights your dashboard provides, however, some data analysts in his team may need a more detailed view. Based on who uses your Excel dashboard, you need to structure the data and the final output.
If your dashboards are to be updated weekly or monthly, you are better off creating a plug-and-play model (where you simply copy-paste the data and it would automatically update). If it’s a one-time exercise only, you can leave out some automation and do that manually.
It’s better to not assume that the client/stakeholder has the latest version of MS Office. I once created a dashboard only to know that my stakeholder was using Excel 2003. This led to some rework as the IFERROR function doesn’t work in Excel 2003 version (which I had used extensively when creating the dashboard).
Dashboards usually fall into one of these three (3) types:
1. Strategic Dashboards
These dashboards are ‘strategic’ because they’re designed to help you make decisions and actions with strategy. They do it by tracking performance related to key performance indicators and help you better understand them.
2. Analytical Dashboards
This type of dashboard focuses on helping you compare data from the past to identify trends, spikes, and drops. By design, analytical dashboards are interactive since they have lots of pivot tables and drill-downs.
3. Operational Dashboards
To date, operational dashboards are the most common type. They show day-to-day metrics which gives a quick view of the organization’s daily performance.