Boston Consulting Group Matrix
MAC & PC Compatible, Fully Unlocked
Immediate download after the payment
| Free Preview Available! BCG Matrix Template PDF Demo |
Overview of BCG Matrix Template
The BCG Matrix Template Template Get Now on Excel Dashboards assesses products on two dimensions. The first dimension looks at the product's general level of growth within its market. The second dimension measures the product’s market share relative to the largest competitor in the industry. Analysing products this way provides a useful insight into the likely opportunities and problems a particular product could face in the future.
The boston consulting matrix is divided into four distinct groups or quadrants: Stars, Cash Cows, Problem Child and Dog. The main takeaway from analysing the product portfolio of a business using the Boston Consulting Matrix is to ensure that the business invests resources wisely on products that are likely to generate superior returns. The Boston Consulting Matrix is based on the theory that an increase in market share will increase revenue through economies of scale.
BCG Matrix Template Available Visualisations
Boston Consulting Matrix
Boston Consulting Group Matrix is a framework created by Boston Consulting Group to evaluate the strategic position of the business brand portfolio and its potential.
| Free Preview Available! BCG Matrix Template PDF Demo |
BCG Matrix Template Template Get Now on Excel Dashboards provides a high-level perspective to see the opportunities for each product in your portfolio.
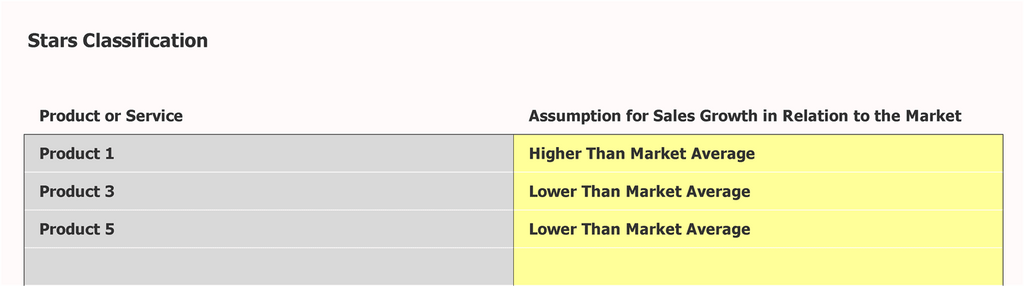
Stars (high market share and high growth)
Star products all have rapid growth and dominant market share. This means that star products can be seen as market-leading products. These products will need a lot of investment to retain their position, to support further growth, as well as, to maintain its lead over competing products. Consequently, star products are also expected to generate a lot of income due to the strong position they have in the market. The main problem for product portfolio managers it to judge whether the market is going to continue to grow, to stagnate or to start its decline. Star products can become Cash Cows as the market growth starts to decline and if the products keep their high market share.
BCG Matrix Template Template Get Now on Excel Dashboards provides a high-level perspective to see the opportunities for each product in your portfolio.
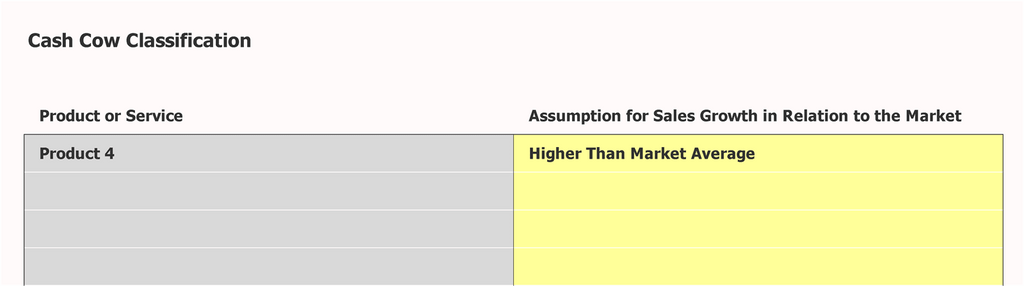
Cash Cows (high market share, low growth)
Cash cows don’t need the same level of investment or support as before. This is due to less competitive pressures with a low growth market and because they usually enjoy a dominant position. Cash cows are still generating a significant level of income but they are not costing the organisation much to maintain. These products can be “milked” to fund Star products.
| Free Preview Available! BCG Matrix Template PDF Demo |
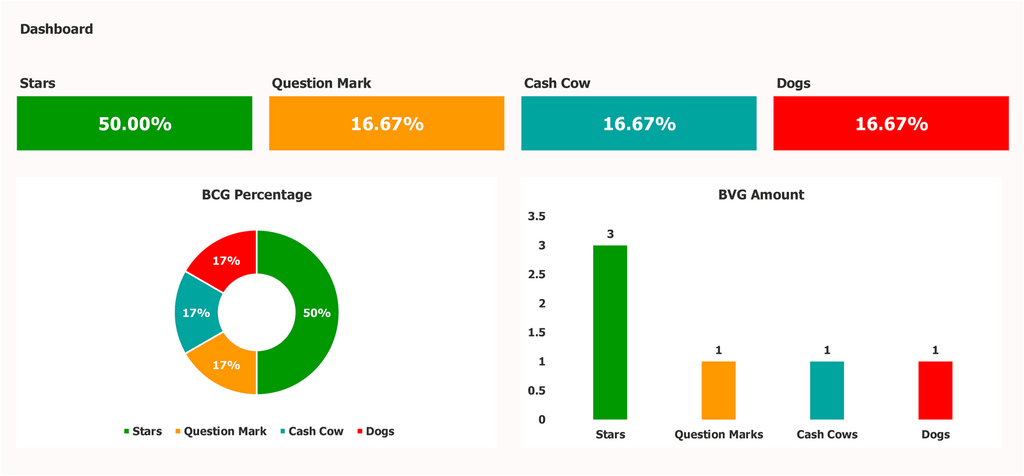
BCG Matrix Template Template Get Now on Excel Dashboards shows if your portfolio is balanced. For example, if you have too few products in your portfolio (and in turn, in your bcg matrix template) then you could be in a dangerous position of having all your eggs in one basket.
Dogs (low market share, low growth)
Products classified as dogs always have a weak market share in a low growth market. These products are very likely generating a loss or a very low profit at best. These products can be a big drain on management time and resources. The question for managers is whether the investment currently being spent on keeping these products alive could be spent on making something that would be more profitable. The answer to this question is usually yes.

The BCG Matrix Template Template Get Now on Excel Dashboards is very simple to use and understand.
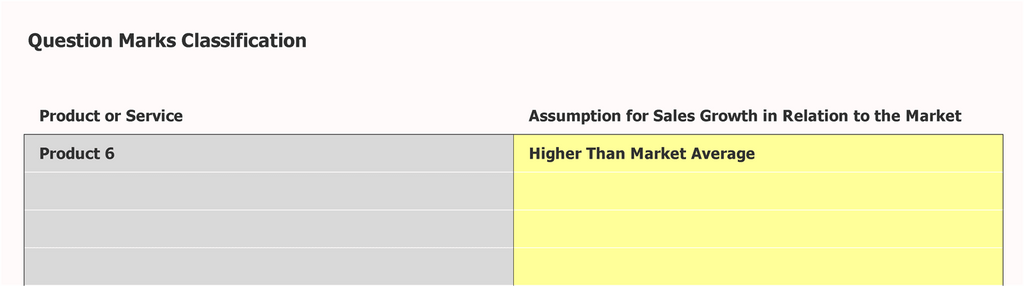
Question Mark / Problem Child (low market share, high growth)
Sometimes referred to as Question Marks, these products prove to be tricky for product managers. These products are in a high growth market but could not seem to gain high share of the market. One reason for this could be that it is a very new product in the market. If this is not the case, then product managers should start asking some questions: What is the organisation doing wrong? What are its competitors doing right? It is possible that these products need more investment behind them to become Stars.